1
REGISTER
Open a live account and start trading in just minutes.
This site uses cookies to provide you with a great user experience. By visiting monetamarkets.com, you accept our cookie policy.
Allow allThis website is operated by Moneta Markets Ltd, which is not authorised or regulated by the UK Financial Conduct Authority (FCA) and does not offer or promote services to UK residents. Access to this website is restricted in the UK and the content is not intended for distribution to, or use by, any person located in the UK. If you believe you have reached this website in error, please exit the page now

Please note that Moneta Markets operates this website and its services are not directed at residents of your jurisdiction.
The information on this site is not intended for distribution to, or use by, any person in any country or jurisdiction where such distribution or use would be contrary to local law or regulation.
If you have arrived here in error, we kindly advise you to exit the site.
Continue to Site
The process whereby one company takes over another by purchasing its shares or assets. An acquisition occurs when one company takes over another, either by buying out its shares or purchasing its assets. This strategic move can lead to growth, …
Funds used by a company to acquire, upgrade, or maintain physical assets. Capital expenditure or CAPEX refers to the funds companies use for acquiring, upgrading, or maintaining physical assets like property, plants, or equipment. These investments are aimed at expanding …
A contract giving the buyer the right, but not the obligation, to buy a security at a specified price within a set time. A call option is a financial contract that gives the buyer the right, but not the obligation, …
The interest rate set by central banks for lending to commercial banks. The base rate is the interest rate established by central banks for lending to commercial banks, which in turn influences all other interest rates in the economy. Changes …
The first currency listed in a currency pair, used as the standard for quoting. The base currency is the first currency listed in a currency pair, serving as the standard for quoting exchange rates. Understanding the base currency is crucial …
The total value of an account, including both cash and unrealised profits or losses from open positions. Account equity is a comprehensive measure of an account’s value, including cash on hand plus any unrealised profits or losses from open positions. …
The total amount of money in a financial account at any given time, reflecting both cash and any unrealised gains or losses from investments or transactions yet to be settled. The account balance represents the total sum of money in …
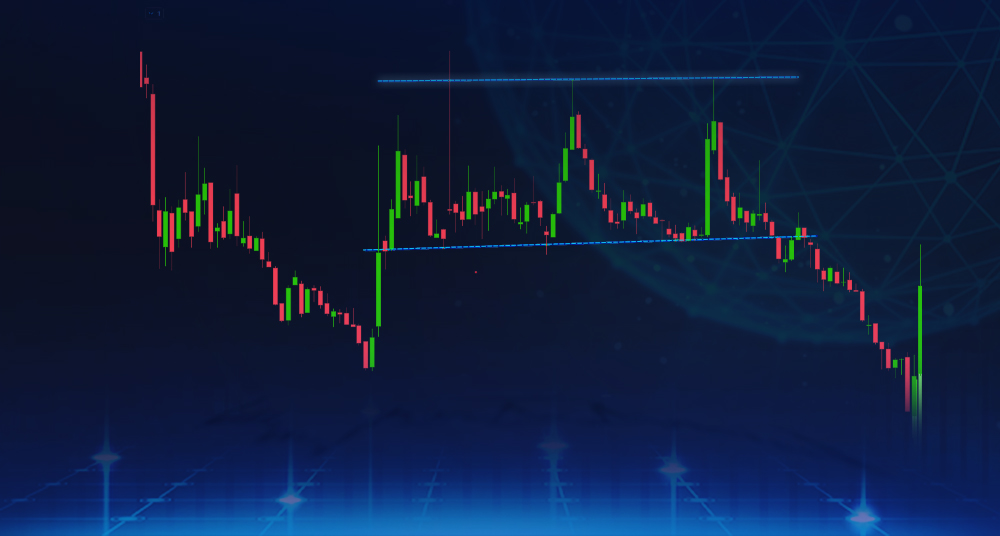
The Triple Top pattern, and how to use it The triple top pattern is a bearish chart pattern that is formed by three distinct peaks, with the price rising to a resistance level and then falling back down each time. …
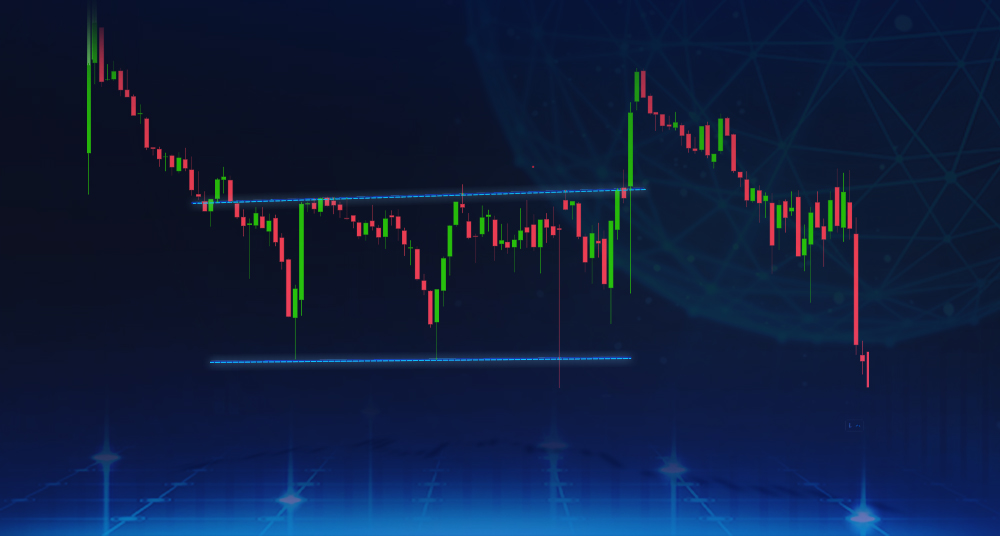
The Triple Bottom pattern, and how to use it The triple bottom pattern is a bullish chart pattern that is formed by three distinct troughs, with the price falling to a support level and then rising back up each time. …
Open a live account and start trading in just minutes.
Fund your account using a wide range of funding methods.
Access 1000+ instruments across all asset classes