This site uses cookies to provide you with a great user experience. By visiting monetamarkets.com, you accept our cookie policy.
Allow allThis site uses cookies to provide you with a great user experience. By visiting monetamarkets.com, you accept our cookie policy.
Allow all
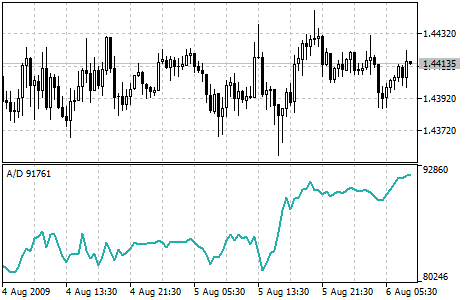
The Accumulation/Distribution Indicator is a technical analysis tool that traders use to identify buying and selling pressure in the markets. It is calculated using the volume traded for a particular security and the price change over a given period of time. The Accumulation/Distribution Indicator is displayed as a line below the main price chart and is used to identify potential buying and selling opportunities based on changes in market sentiment.
Traders typically use the Accumulation/Distribution Indicator to identify potential buying and selling opportunities based on changes in market sentiment. If the Accumulation/Distribution Indicator is rising, this may be an indication that the security is being accumulated by buyers, which could signal a potential uptrend. On the other hand, if the Accumulation/Distribution Indicator is falling, this may be an indication that the security is being distributed by sellers, which could signal a potential downtrend. Traders can use the Accumulation/Distribution Indicator in conjunction with other technical indicators to confirm the strength of a trend or to identify potential entry and exit points for trades.
To add the Accumulation/Distribution Indicator to a chart in MetaTrader 4 (MT4) or MetaTrader 5 (MT5), follow these steps: