This site uses cookies to provide you with a great user experience. By visiting monetamarkets.com, you accept our cookie policy.
Allow allThis site uses cookies to provide you with a great user experience. By visiting monetamarkets.com, you accept our cookie policy.
Allow all
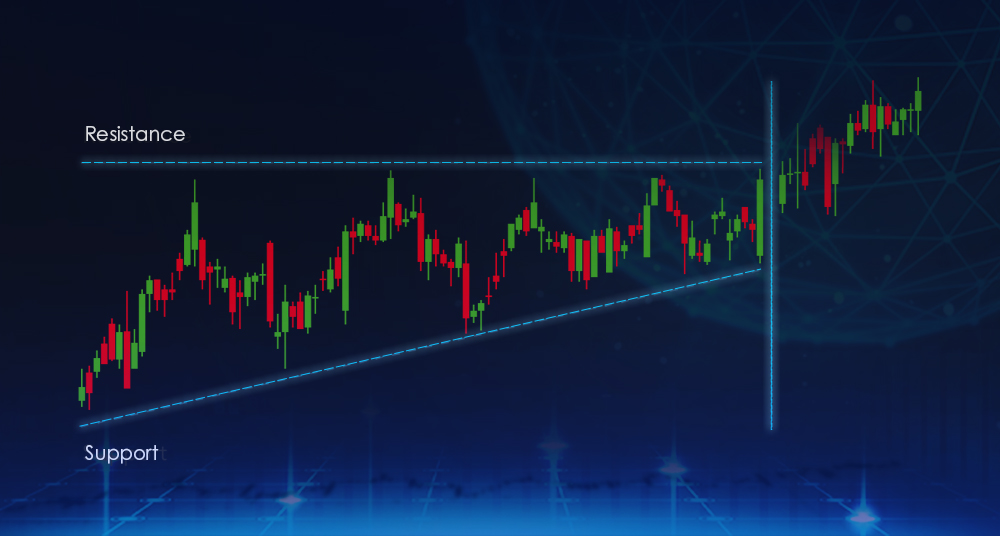
The ascending triangle is a bullish chart pattern that is formed by a horizontal resistance level and an upward sloping support level.
This pattern is created when the price of an asset is restrained by a horizontal resistance level, but the support level is steadily increasing. The ascending triangle is a continuation pattern, which means that it is typically seen as a bullish sign and indicates that the asset’s price is likely to continue rising.
To form an ascending triangle, the asset’s price will typically make a series of higher lows and test the resistance level several times before breaking through. Once the price breaks through the resistance level, it is likely to continue rising, as traders will likely enter into long positions and push the price higher.
One of the key characteristics of the ascending triangle is that the trading volume tends to decrease as the pattern progresses. This is because the horizontal resistance level acts as a barrier, preventing the price from breaking through and causing traders to become less active. However, once the price does break through the resistance level, trading volume tends to increase as traders enter into long positions and push the price higher.

It is important to note that the ascending triangle is a bullish pattern, but it is not a guarantee that the asset’s price will rise. As with any trading strategy, it is important to use risk management techniques and to always be aware of the potential for losses.
CFDs are complex instruments and come with a high risk of losing money rapidly due to leverage. You should consider whether you understand how CFDs work and whether you can afford to take the high risk of losing your money. Trading derivatives is risky. It isn't suitable for everyone; you could lose substantially more than your initial investment. You don't own or have rights to the underlying assets. Past performance is no indication of future performance and tax laws are subject to change. The information on this website is general in nature and doesn't consider your personal objectives, financial circumstances, or needs. Please read our legal documents and ensure that you fully understand the risks before you make any trading decisions.
The information on this site is not intended for residents of Canada, Cyprus, France, Spain, Russia, Ukraine, Italy, the United States, or use by any person in any country or jurisdiction where such distribution or use would be contrary to local law or regulation.
Moneta Markets is a trading name of Moneta Markets (Pty) Ltd, an authorised Financial Service Provider (“FSP”) registered and regulated by the Financial Sector Conduct Authority (“FSCA”) of South Africa under license number 47490 and located at 1 Hood Avenue, Rosebank, Johannesburg, Gauteng 2196, South Africa. Company Registration Number: 2016 / 063801 / 07. Contact Phone Number: +27 (10) 1429139. Operational Office: Unit 7, 31 First Avenue East, Parktown North, Gauteng, Johannesburg, 2193, South Africa.
Mmonexia Ltd, facilitates payment services to the licensed and regulated entities within the Moneta Markets Organizational structure.
Mmonexia Ltd registered in the Republic of Cyprus with registration number HE436544 and registered address at Archbishop Makarios III, 160, Floor 1, 3026, Limassol, Cyprus. Mmonexia Ltd, facilitates payment services to the licensed and regulated entities within the Moneta Markets Organizational structure.
Moneta Markets Limited. Business Registration Number:72493069. Registration Address: Flat/RM A 12/F ZJ 300, 300 Lockhart Road, Wan Chai, Hong Kong. Contact Phone Number: +852 37522556. Operational Office: Unit 1201, 12/F, FWD Financial Centre, 308 Des Voeux Road Central, Sheung Wan, Hong Kong.
Moneta Markets is a trading name of Moneta Markets (Pty) Ltd, an authorised Financial Service Provider (“FSP”) registered and regulated by the Financial Sector Conduct Authority (“FSCA”) of South Africa under license number 47490 and located at 1 Hood Avenue, Rosebank, Johannesburg, Gauteng 2196, South Africa. Company Registration Number: 2016 / 063801 / 07. Contact Phone Number: +27 (10) 1429139. Operational Office: 31 First Avenue East, Parktown North, Gauteng, Johannesburg, 2193, South Africa.
Moneta Markets is a trading name of Moneta Markets Ltd, registered under Saint Lucia Registry of International Business Companies with registration number 2023-00068.
Mmonexia Ltd registered in the Republic of Cyprus with registration number HE436544 and registered address at Archbishop Makarios III, 160, Floor 1, 3026, Limassol, Cyprus.
Moneta Markets PTY LTD soliciting Business from UAE through a Non-Exclusive Introducing Broker Agreement Regulated by SCA , Sterling Financial Services LLC ,Cat 5 ,No 305029