This site uses cookies to provide you with a great user experience. By visiting monetamarkets.com, you accept our cookie policy.
Allow allThis site uses cookies to provide you with a great user experience. By visiting monetamarkets.com, you accept our cookie policy.
Allow all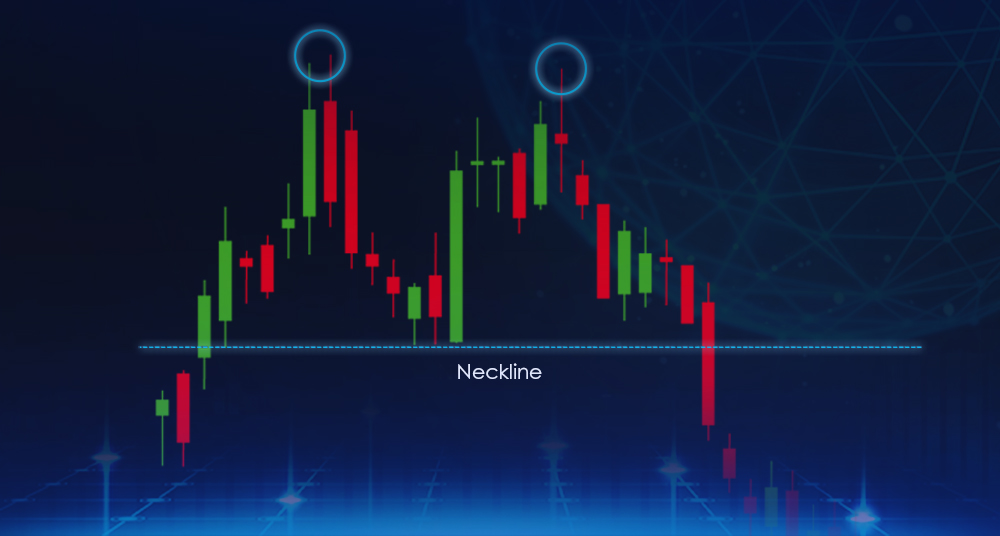
The double top is a bearish chart pattern that is formed by two consecutive peaks at approximately the same price level, separated by a trough. This pattern is created when the price of an asset rises to a resistance level, falls back down, and then rises again to the same resistance level before eventually falling. The double top is a reversal pattern, which means that it is typically seen as a bearish sign and indicates that the asset’s price is likely to reverse its upward trend and start falling.
To form a double top, the asset’s price will typically rise to a resistance level, fall back down, and then rise again to the same resistance level before eventually breaking through the support level and falling. The pattern is typically completed when the price breaks through the support level, at which point it is likely to continue falling as traders enter into short positions.
One of the key characteristics of the double top pattern is that the trading volume tends to increase as the pattern progresses. This is because the price is making a significant move and there is more activity from traders. However, once the price does break through the support level, trading volume may decrease as the price starts to fall and traders become less active.

It is important to note that the double top pattern is a bearish pattern, but it is not a guarantee that the asset’s price will fall. As with any trading strategy, it is important to use risk management techniques and to always be aware of the potential for losses.
One way to trade the double top pattern is to set a sell order just below the support level, as this is where the price is likely to break through and start falling. Traders can also set a stop loss order just above the resistance level, in case the price does not break through the support and instead rises back