This site uses cookies to provide you with a great user experience. By visiting monetamarkets.com, you accept our cookie policy.
Allow allThis site uses cookies to provide you with a great user experience. By visiting monetamarkets.com, you accept our cookie policy.
Allow all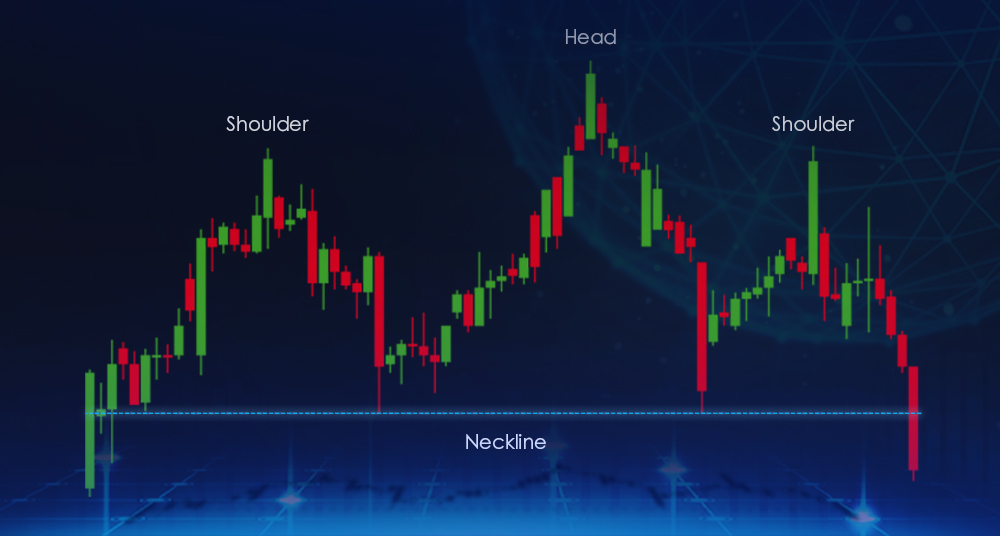
The head and shoulders pattern is a bearish chart pattern that is formed by a peak, followed by a higher peak, and then a final lower peak. The pattern gets its name because it looks like a head with two shoulders on either side. This pattern is created when the price of an asset rises to a resistance level, falls back down, and then rises again to a higher resistance level before eventually falling. The head and shoulders pattern is a reversal pattern, which means that it is typically seen as a bearish sign and indicates that the asset’s price is likely to reverse its upward trend and start falling.
To form a head and shoulders pattern, the asset’s price will typically rise to a resistance level, fall back down, and then rise again to a higher resistance level before eventually breaking through the support level and falling. The pattern is typically completed when the price breaks through the neckline, which is a trendline that connects the lows between the left shoulder, head, and right shoulder.
One of the key characteristics of the head and shoulders pattern is that the trading volume tends to increase as the pattern progresses. This is because the price is making a significant move and there is more activity from traders. However, once the price does break through the neckline, trading volume may decrease as the price starts to fall and traders become less active.

It is important to note that the head and shoulders pattern is a bearish pattern, but it is not a guarantee that the asset’s price will fall. As with any trading strategy, it is important to use risk management techniques and to always be aware of the potential for losses.
One way to trade the head and shoulders pattern is to set a sell order just below the neckline, as this is where the price is likely to break through and start falling. Traders can also set a stop loss order just above the right shoulder peak, in case the price does not break through the neckline and instead rises back up.
Another way to trade the head and shoulders pattern is to wait for confirmation that the price has indeed broken through the neckline before entering into a short position. This can be done by looking for additional bearish signals, such as a bearish crossover on a moving average or a bearish candlestick pattern.
It is important to keep in mind that the head and shoulders pattern can take some time to form, as the price needs to rise to the resistance level, fall back down, and then rise again to the higher resistance level before breaking through the neckline and falling. Traders should be patient and wait for the pattern to complete before entering into a trade.