This site uses cookies to provide you with a great user experience. By visiting monetamarkets.com, you accept our cookie policy.
Allow allThis site uses cookies to provide you with a great user experience. By visiting monetamarkets.com, you accept our cookie policy.
Allow allThis website is operated by Moneta Markets Ltd, which is not authorised or regulated by the UK Financial Conduct Authority (FCA) and does not offer or promote services to UK residents. Access to this website is restricted in the UK and the content is not intended for distribution to, or use by, any person located in the UK. If you believe you have reached this website in error, please exit the page now

Please note that Moneta Markets operates this website and its services are not directed at residents of your jurisdiction.
The information on this site is not intended for distribution to, or use by, any person in any country or jurisdiction where such distribution or use would be contrary to local law or regulation.
If you have arrived here in error, we kindly advise you to exit the site.
Continue to Site

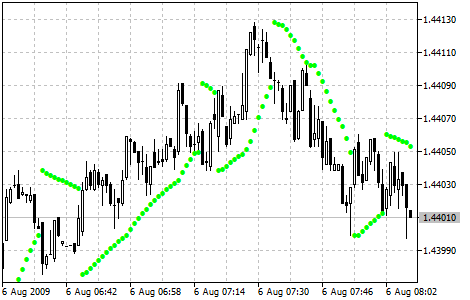
The Parabolic Stop and Reverse (SAR) is a technical analysis indicator that is used to determine the direction and strength of a trend, as well as to signal potential trend reversals. The SAR is calculated by plotting dots on a chart that indicate where the price is likely to stop and reverse direction. The indicator is called ”parabolic” because the dots form a parabolic shape as the trend continues.
Traders often use the Parabolic SAR to identify potential buying and selling opportunities. For example, if the dots are below the price, it may indicate that the security is in an uptrend, while dots above the price may suggest that it is in a downtrend. Additionally, traders can watch for a reversal of the dots, where they change from below the price to above the price or vice versa. This may signal a potential trend reversal and provide an opportunity to enter or exit a trade.
To add the Parabolic SAR to a chart in MetaTrader 4 (MT4) or MetaTrader 5 (MT5), follow these steps: