This site uses cookies to provide you with a great user experience. By visiting monetamarkets.com, you accept our cookie policy.
Allow allThis site uses cookies to provide you with a great user experience. By visiting monetamarkets.com, you accept our cookie policy.
Allow all
The Relative Strength Index (RSI) is a momentum indicator that measures the magnitude of recent price changes to evaluate overbought or oversold conditions in the price of a stock or other asset. It is a popular technical analysis tool that traders use to identify potential buying and selling opportunities.
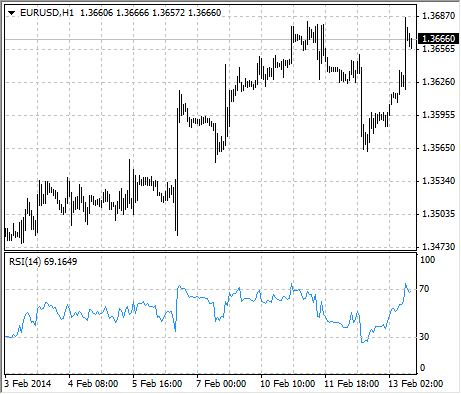
Traders typically use the RSI to identify potential buying and selling opportunities based on overbought and oversold conditions. For example, if the RSI is above 70, the asset may be considered overbought and may be due for a pullback or correction. On the other hand, if the RSI is below 30, the asset may be considered oversold and may be due for a bounce or rally. Traders can also use the RSI to confirm the strength of a trend or to identify potential trend reversals. For example, a rising RSI may indicate that a uptrend is gaining strength, while a falling RSI may suggest that the trend is losing momentum.
To add the RSI to a chart in MetaTrader 4 (MT4) or MetaTrader 5 (MT5), follow these steps: