1
REGISTER
Open a live account and start trading in just minutes.
This site uses cookies to provide you with a great user experience. By visiting monetamarkets.com, you accept our cookie policy.
Allow all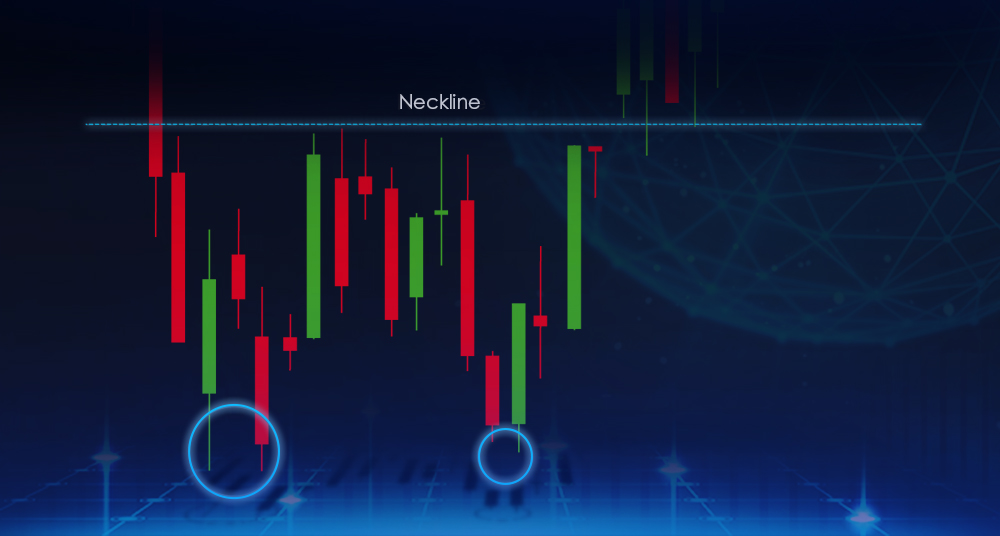
The Double Bottom pattern, and how to use it The double bottom is a bullish chart pattern that is formed by two consecutive troughs at approximately the same price level, separated by a peak. This pattern is created when the …
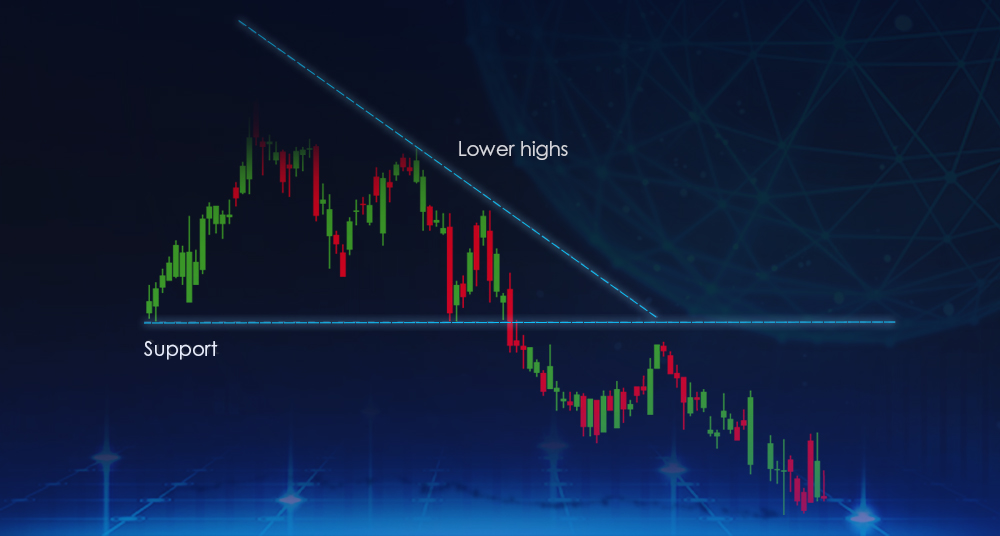
The Descending Triangle pattern, and how to use it The descending triangle is a bearish chart pattern that is formed by a horizontal support level and a downward sloping resistance level. This pattern is created when the price of an …
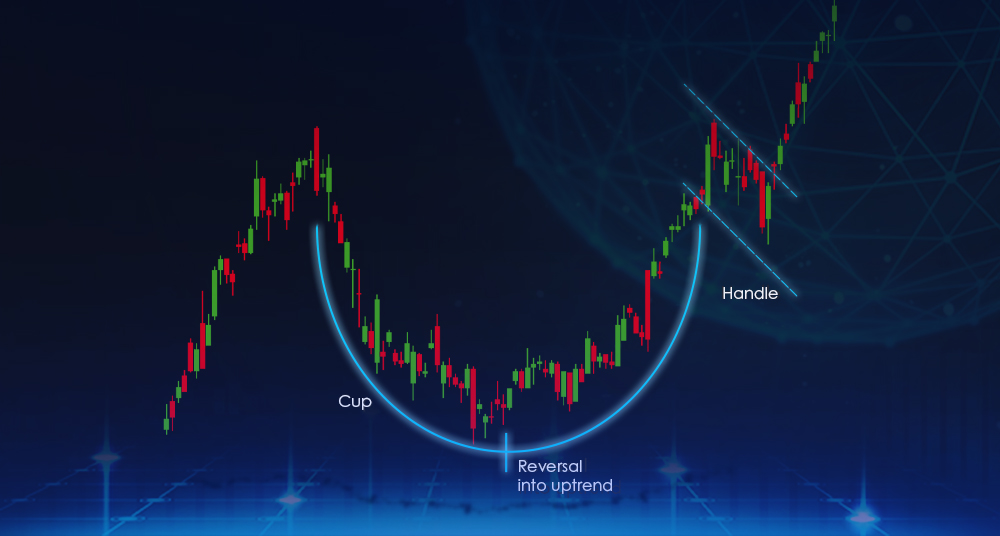
The Cup And Handle pattern, and how to use it The cup and handle is a chart pattern that is formed by a “cup” shaped pattern and a subsequent “handle” that looks like a small flag or triangle. This pattern …
The Bullish Triangle pattern, and how to use it The bullish triangle is a chart pattern that is formed by a horizontal support level and an upward sloping resistance level. This pattern is created when the price of an asset …
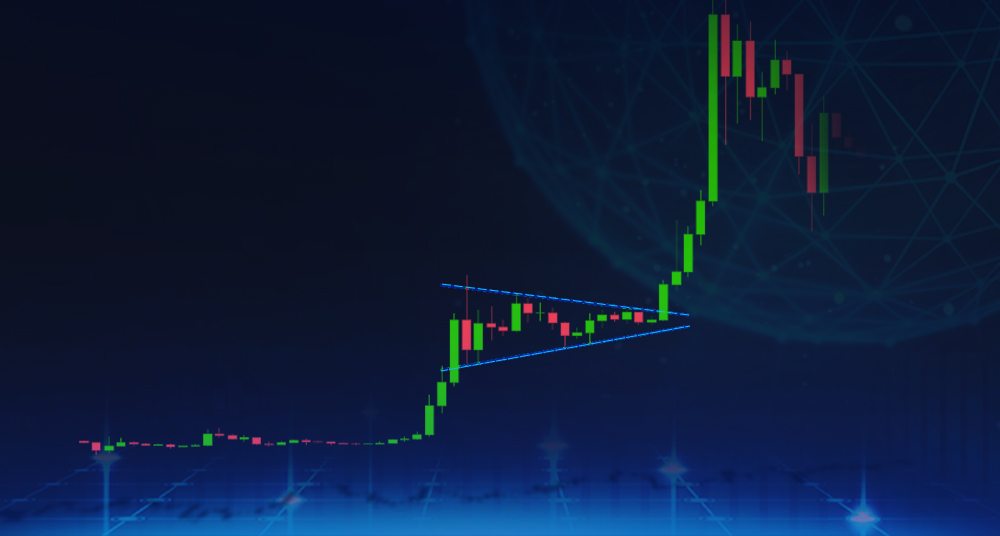
The Bullish Pennant pattern, and how to use it The bullish pennant is a chart pattern that is formed by an upward sloping resistance level and a converging support level. This pattern is created when the price of an asset …

The Bullish Flag pattern, and how to use it The bullish flag is a chart pattern that is formed by an upward sloping resistance level and a horizontal support level. This pattern is created when the price of an asset …

The Bearish Triangle pattern, and how to use it The bearish triangle is a chart pattern that is formed by a horizontal resistance level and a downward sloping support level. This pattern is created when the price of an asset …
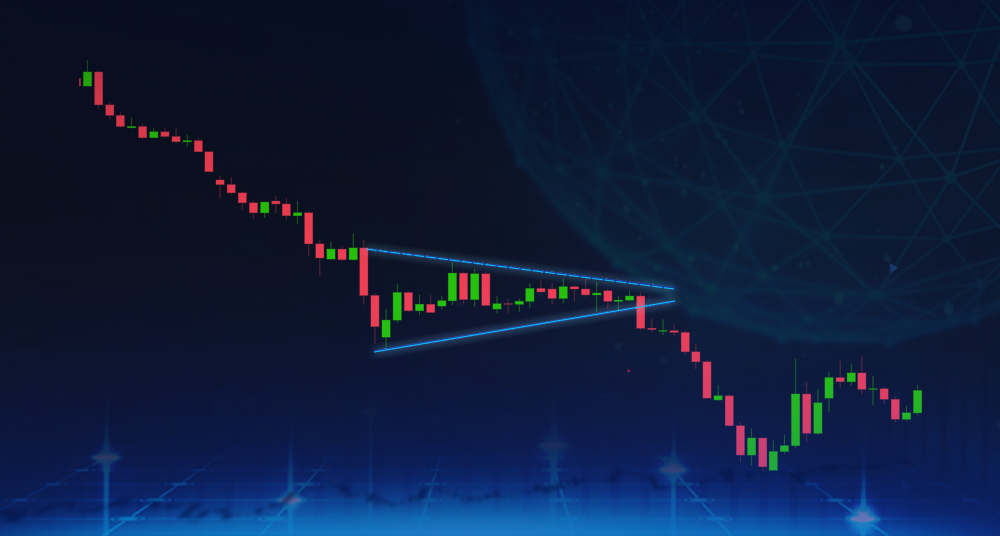
The Bearish Pennant pattern, and how to use it The bearish pennant is a chart pattern that is formed by a downward sloping resistance level and a converging support level. This pattern is created when the price of an asset …

The Bearish Flag pattern, and how to use it The bearish flag is a chart pattern that is formed by a downward sloping resistance level and a horizontal support level. This pattern is created when the price of an asset …
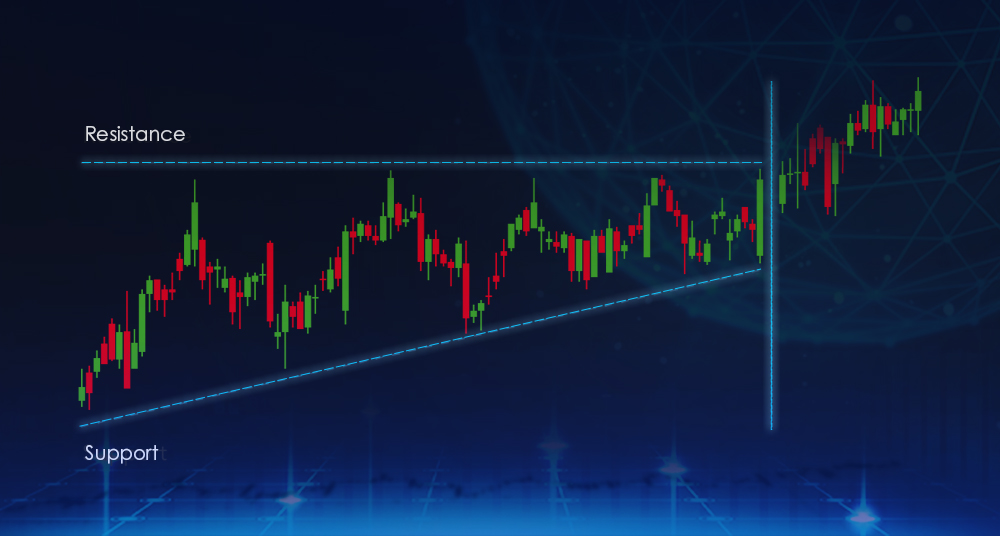
The Ascending Triangle pattern, and how to use it The ascending triangle is a bullish chart pattern that is formed by a horizontal resistance level and an upward sloping support level. This pattern is created when the price of an …
Open a live account and start trading in just minutes.
Fund your account using a wide range of funding methods.
Access 1000+ instruments across all asset classes