1
REGISTER
Open a live account and start trading in just minutes.
This site uses cookies to provide you with a great user experience. By visiting monetamarkets.com, you accept our cookie policy.
Allow allThis website is operated by Moneta Markets Ltd, which is not authorised or regulated by the UK Financial Conduct Authority (FCA) and does not offer or promote services to UK residents. Access to this website is restricted in the UK and the content is not intended for distribution to, or use by, any person located in the UK. If you believe you have reached this website in error, please exit the page now

Please note that Moneta Markets operates this website and its services are not directed at residents of your jurisdiction.
The information on this site is not intended for distribution to, or use by, any person in any country or jurisdiction where such distribution or use would be contrary to local law or regulation.
If you have arrived here in error, we kindly advise you to exit the site.
Continue to Site
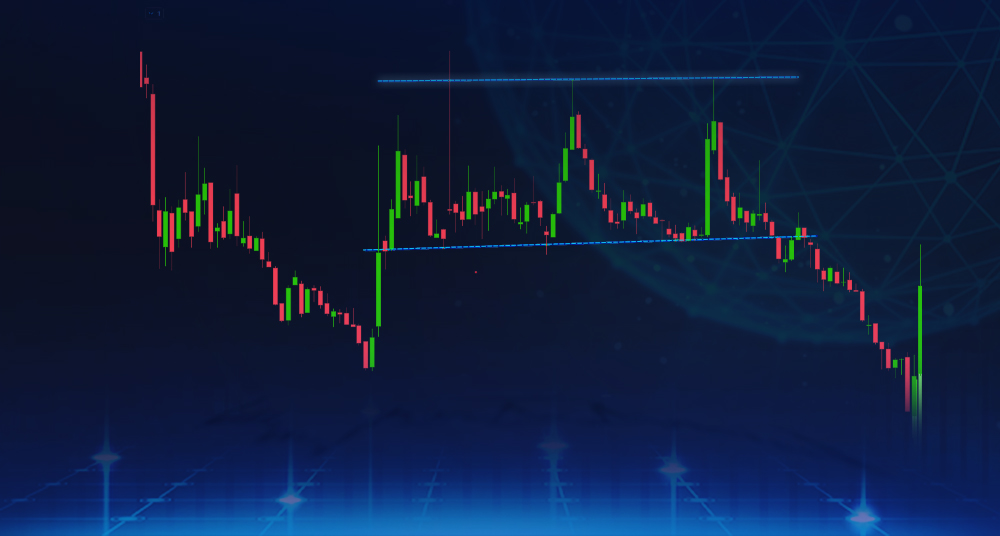
The Triple Top pattern, and how to use it The triple top pattern is a bearish chart pattern that is formed by three distinct peaks, with the price rising to a resistance level and then falling back down each time. …
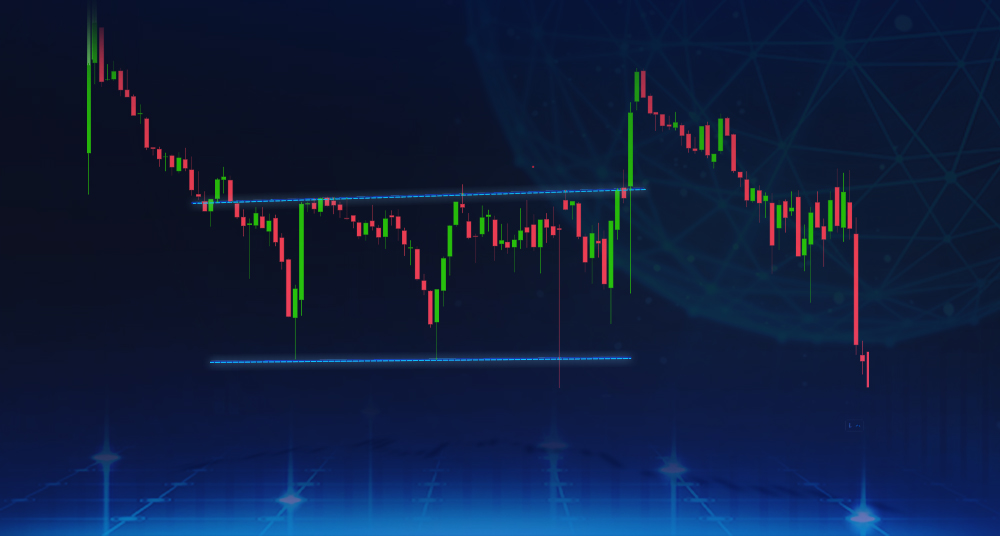
The Triple Bottom pattern, and how to use it The triple bottom pattern is a bullish chart pattern that is formed by three distinct troughs, with the price falling to a support level and then rising back up each time. …
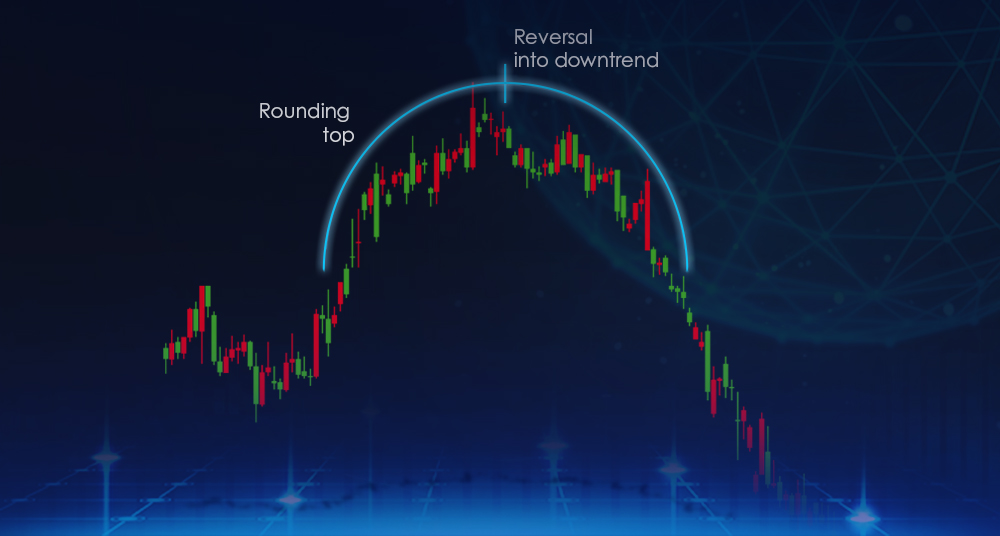
The Rounded Top pattern, and how to use it The rounded top pattern, also known as a saucer top pattern, is a bearish chart pattern that is formed by a rounded, “U” shaped pattern. This pattern is created when the …
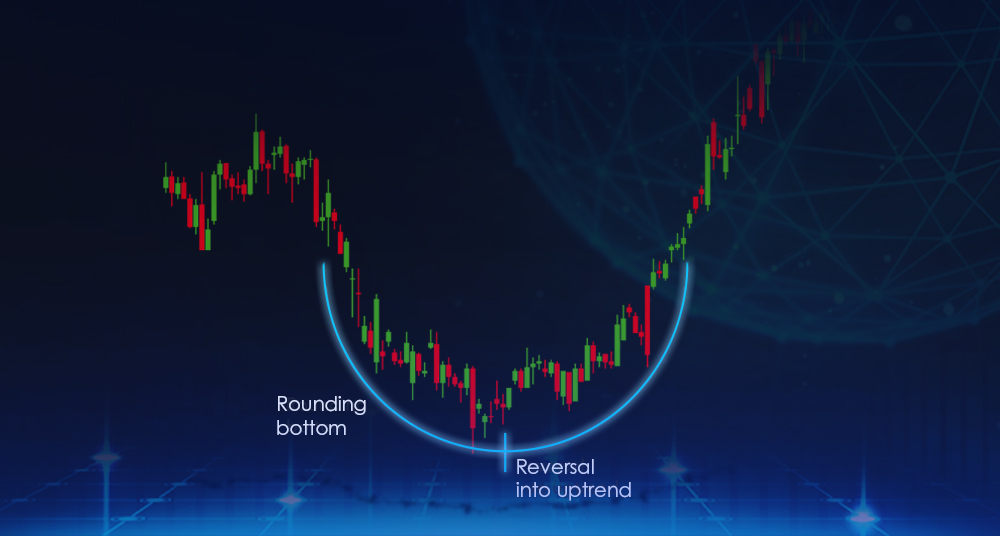
The Rounded Bottom pattern, and how to use it The rounded bottom pattern, also known as a saucer bottom pattern, is a bullish chart pattern that is formed by a rounded, “U” shaped pattern. This pattern is created when the …
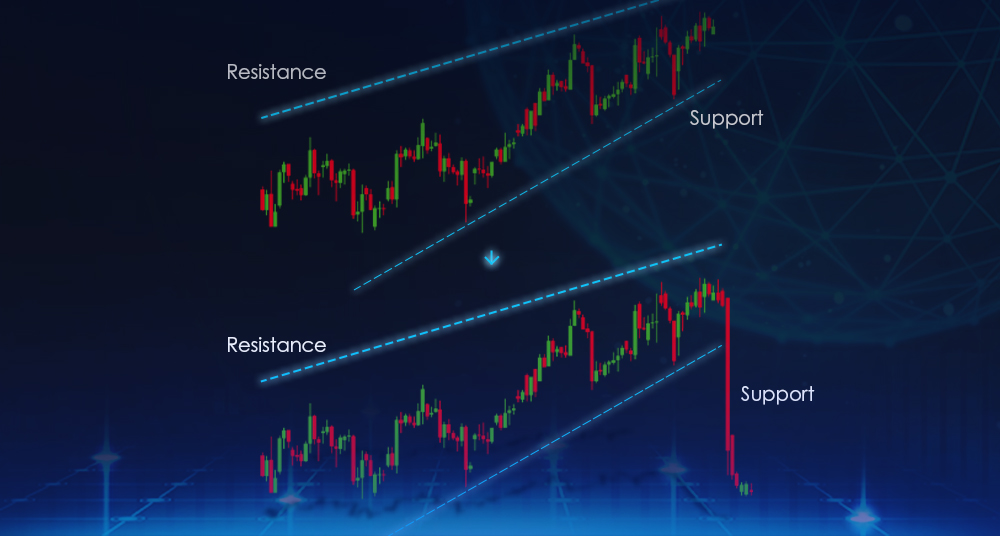
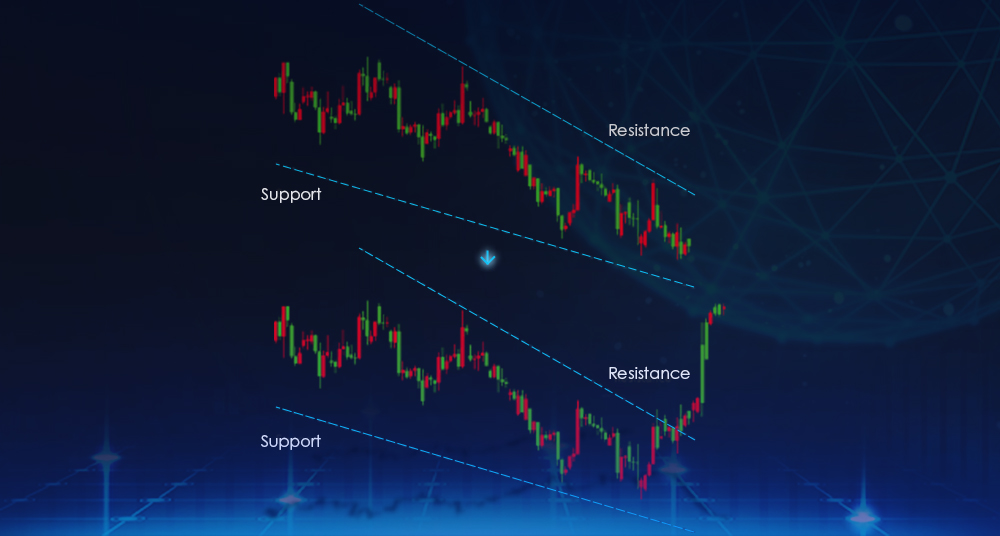
The Rising Wedge pattern, and how to use it The rising wedge pattern is a bearish chart pattern that is formed by a diagonal line with a slope that is upward and to the right. This pattern is created when …
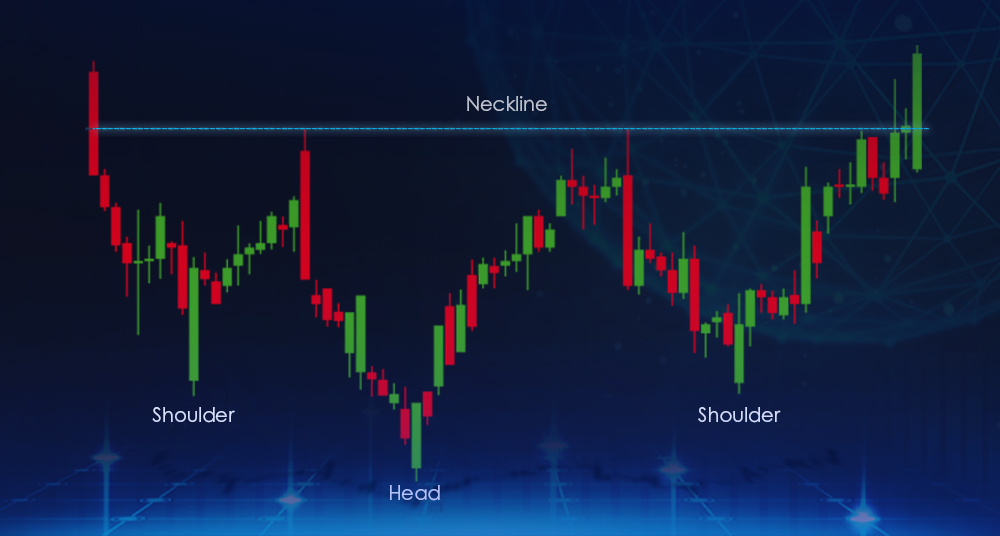
The Inverted Head And Shoulders pattern, and how to use it The inverted head and shoulders pattern is a bullish chart pattern that is formed by a trough, followed by a lower trough, and then a final higher trough. The …
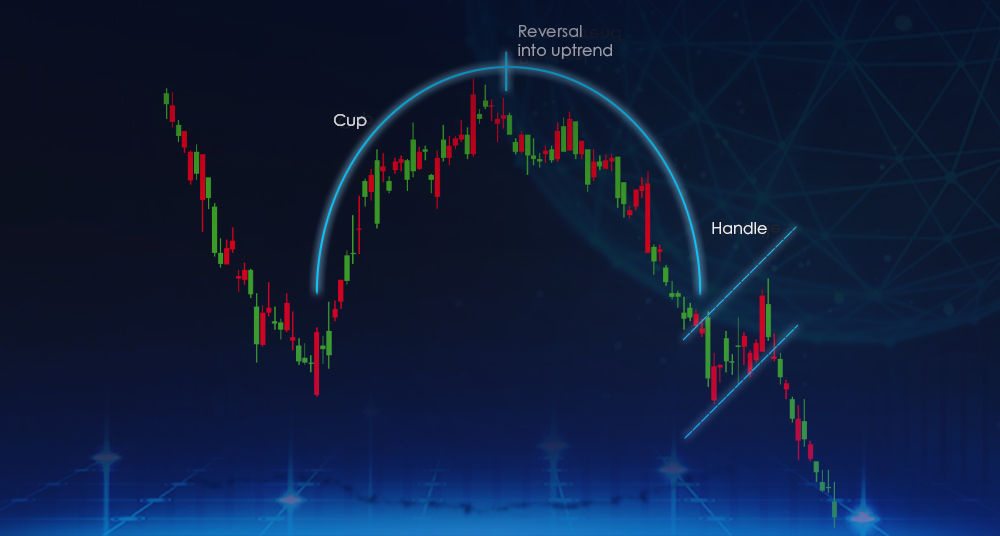
The Inverted Cup And Handle pattern, and how to use it The inverted cup and handle is a bearish chart pattern that is formed by a “cup” shaped pattern with a downward sloping handle. This pattern is created when the …
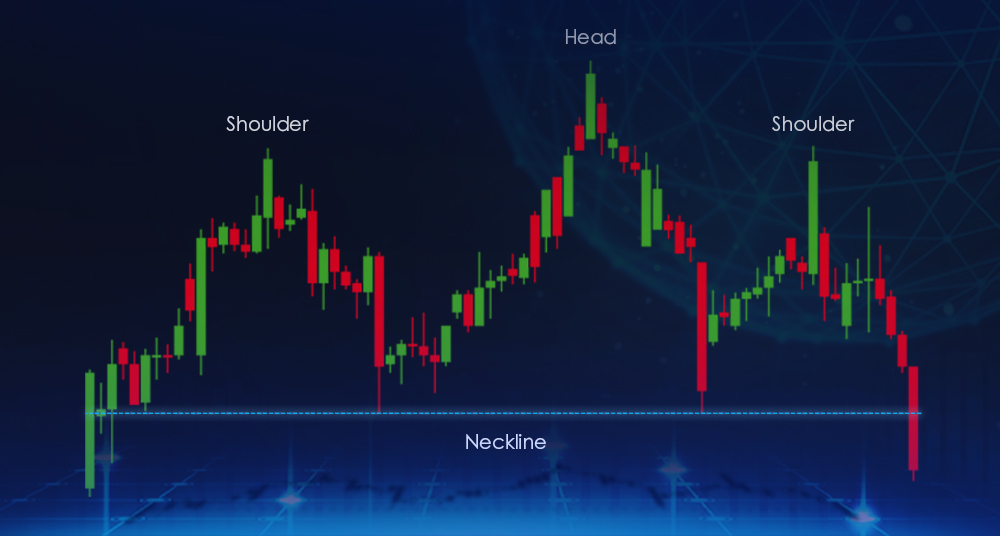
The Head And Shoulders pattern, and how to use it The head and shoulders pattern is a bearish chart pattern that is formed by a peak, followed by a higher peak, and then a final lower peak. The pattern gets …
The Falling Wedge pattern, and how to use it The falling wedge is a bullish chart pattern that is formed by a downward sloping support level and an downward sloping resistance level that converges. This pattern is created when the …
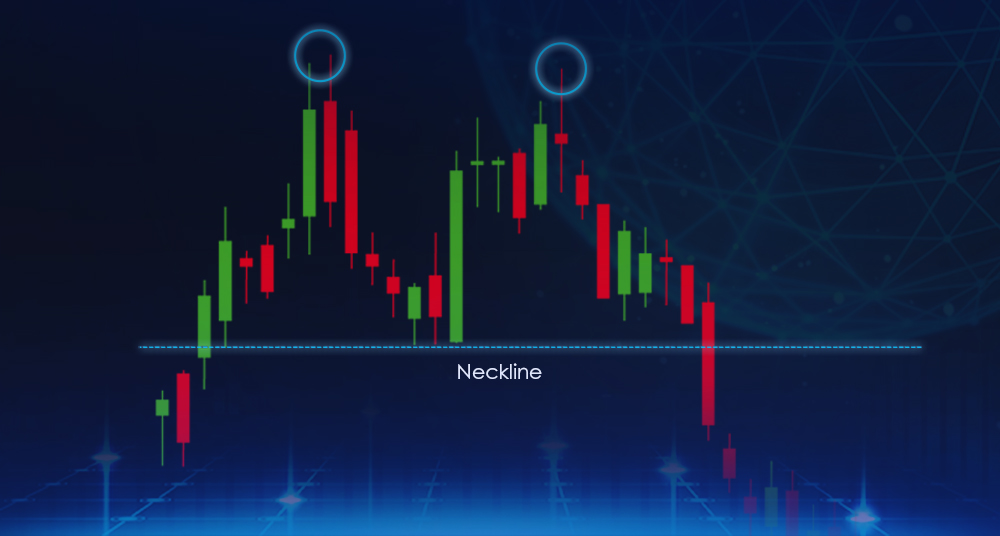
The Double Top pattern, and how to use it The double top is a bearish chart pattern that is formed by two consecutive peaks at approximately the same price level, separated by a trough. This pattern is created when the …
Open a live account and start trading in just minutes.
Fund your account using a wide range of funding methods.
Access 1000+ instruments across all asset classes